Today's Trend Wizard Timing Tool had a Crossover and also a look at the Vancouver Real Estate Bubble.
The chart below says it all, A crossover on the Trend Wizard Timing Tool means a change in trend. How long? I don't know, but the US stock indexes could change direction... if that's the case, I change my position from short to long.
The chart below says it all, A crossover on the Trend Wizard Timing Tool means a change in trend. How long? I don't know, but the US stock indexes could change direction... if that's the case, I change my position from short to long.
The chart below is the daily chart of the S and P 500 and how the expanding triangle top on the Elliott Wave count wave 2 (not indicated in the chart) could break down into a wave 3 impulse wave down OR go sideways into a complex corrective wave. I just catch the waves, lets not make this complicated. Bearish is the start of the trend, so lets get bearish.
The weekly chart of the S and P 500 show's you a simple Stochastics momentum indicator crossover (actually crossed last week but who's counting). The price is showing lower lows and lower highs another tell tale sign. Also, the price needs to tag the previous resistance line, the 1600 range before going higher (That's just the way it is).
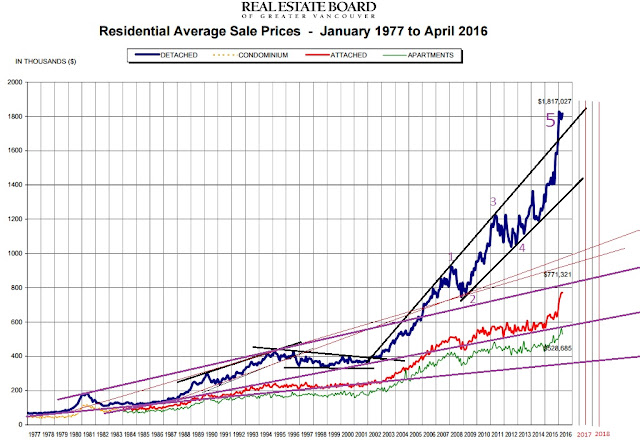
Last but not least the Vancouver Real Estate Bubble. I love charts and this chart does say BUBBLE big time. I love charts and when price goes parabolic and there's no bid at the top... PRICE ALWAYS COMES DOWN... the trick to it is... at what price and when will the top be.
I got the chart from Katusa Research and butchered it, check it out... it's a great article explaining why the Vancouver real estate market is going up to stupid levels
Same chart as above just another count. Either way it's a blow off.
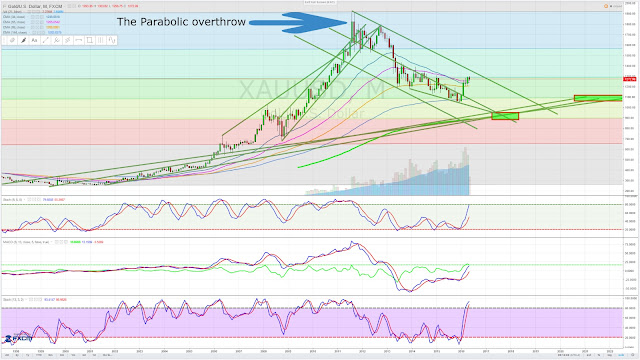
As much as I hate to see it. Gold might have to tag the $900.00 an ounce area before going on it's way, might not be done yet. As Marc Faber says... "the investor who looses the least in this downturn will win in the end"... so if gold does tag the $900.00... What will everything else be worth? something to think about.
Gold Monthly Chart - Vancouver Real Estate Parabolic Overthrow Comparison - May 2016 - Target 900.00 dollars - without the indicators
See the parabolic overthrow...


No comments:
Post a Comment