
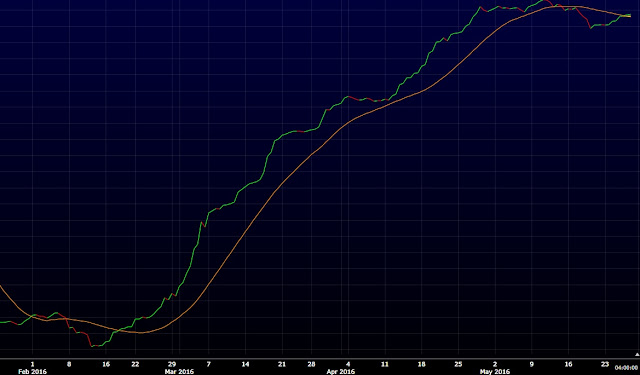
The Trend Wizard Timing Tool is indicating bullish behavior with the crossover to upside.


The chart below is an hourly chart of the S &P 500. The Ascending triangle complete with 5 waves should prove to break out to the upside.

The chart below is a daily chart of the S&P 500 with a failed head and shoulders chart pattern. When a chart pattern fails to do what it's supposed to do, that pattern is done and you have to listen to the market.

No comments:
Post a Comment